English III 2021
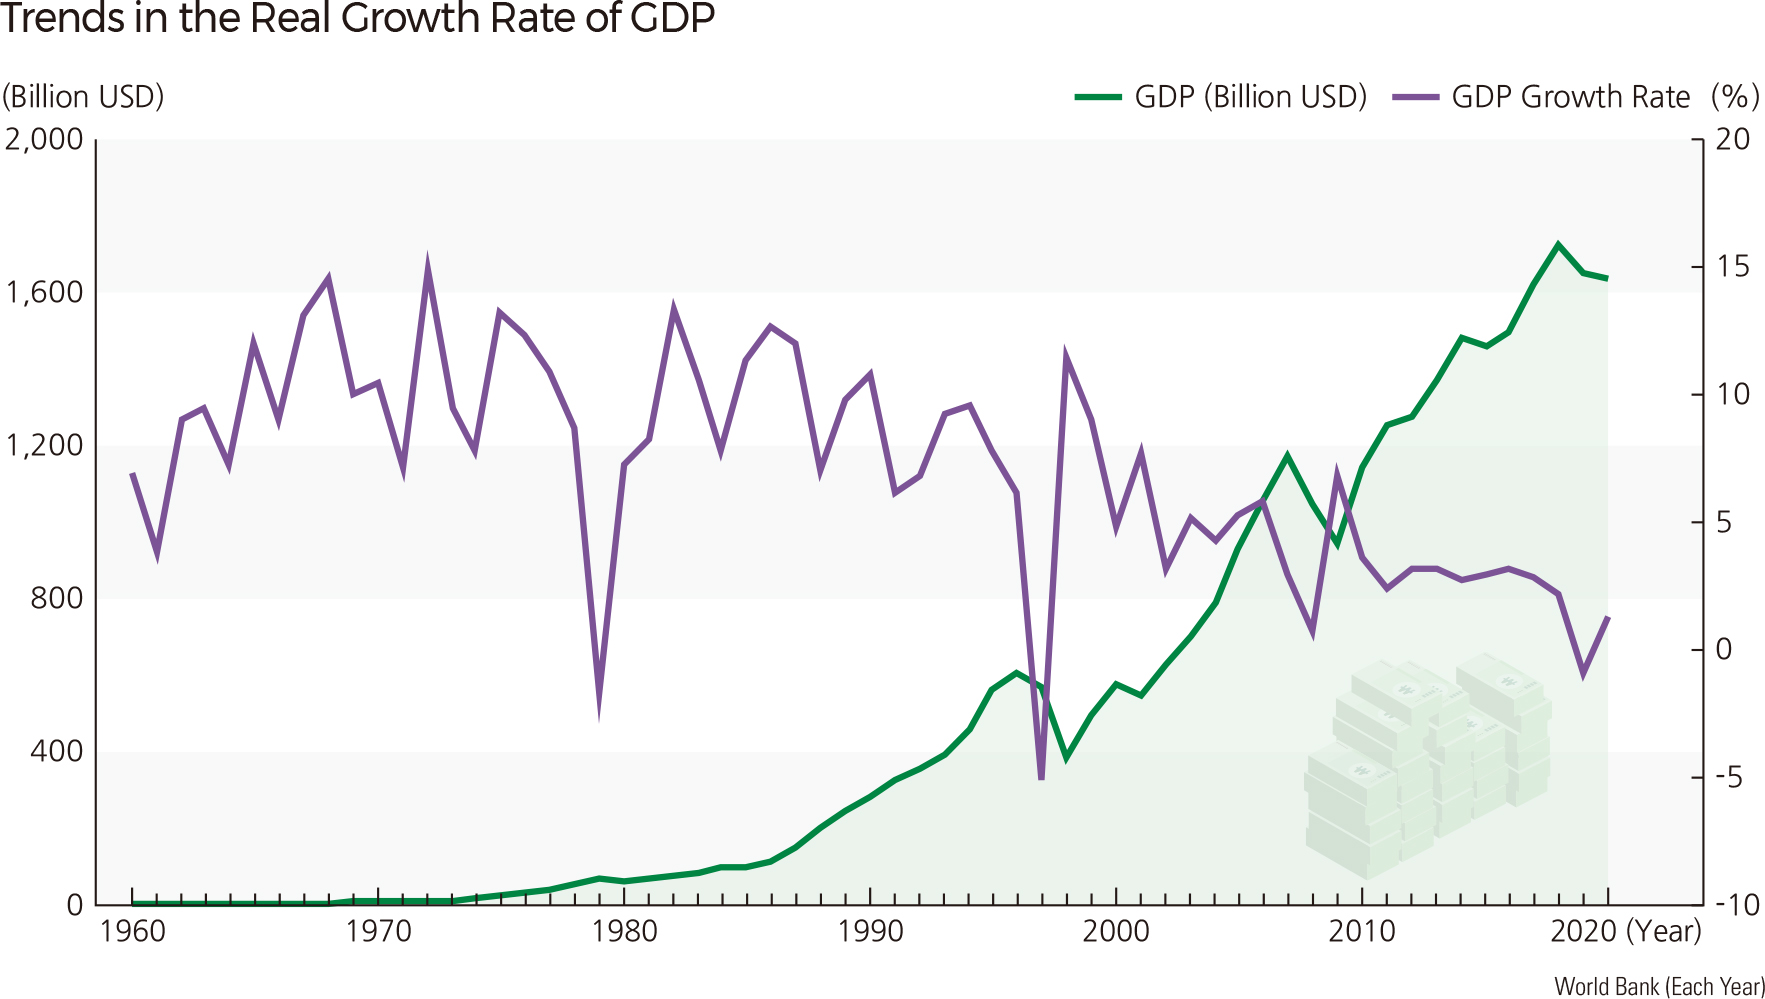
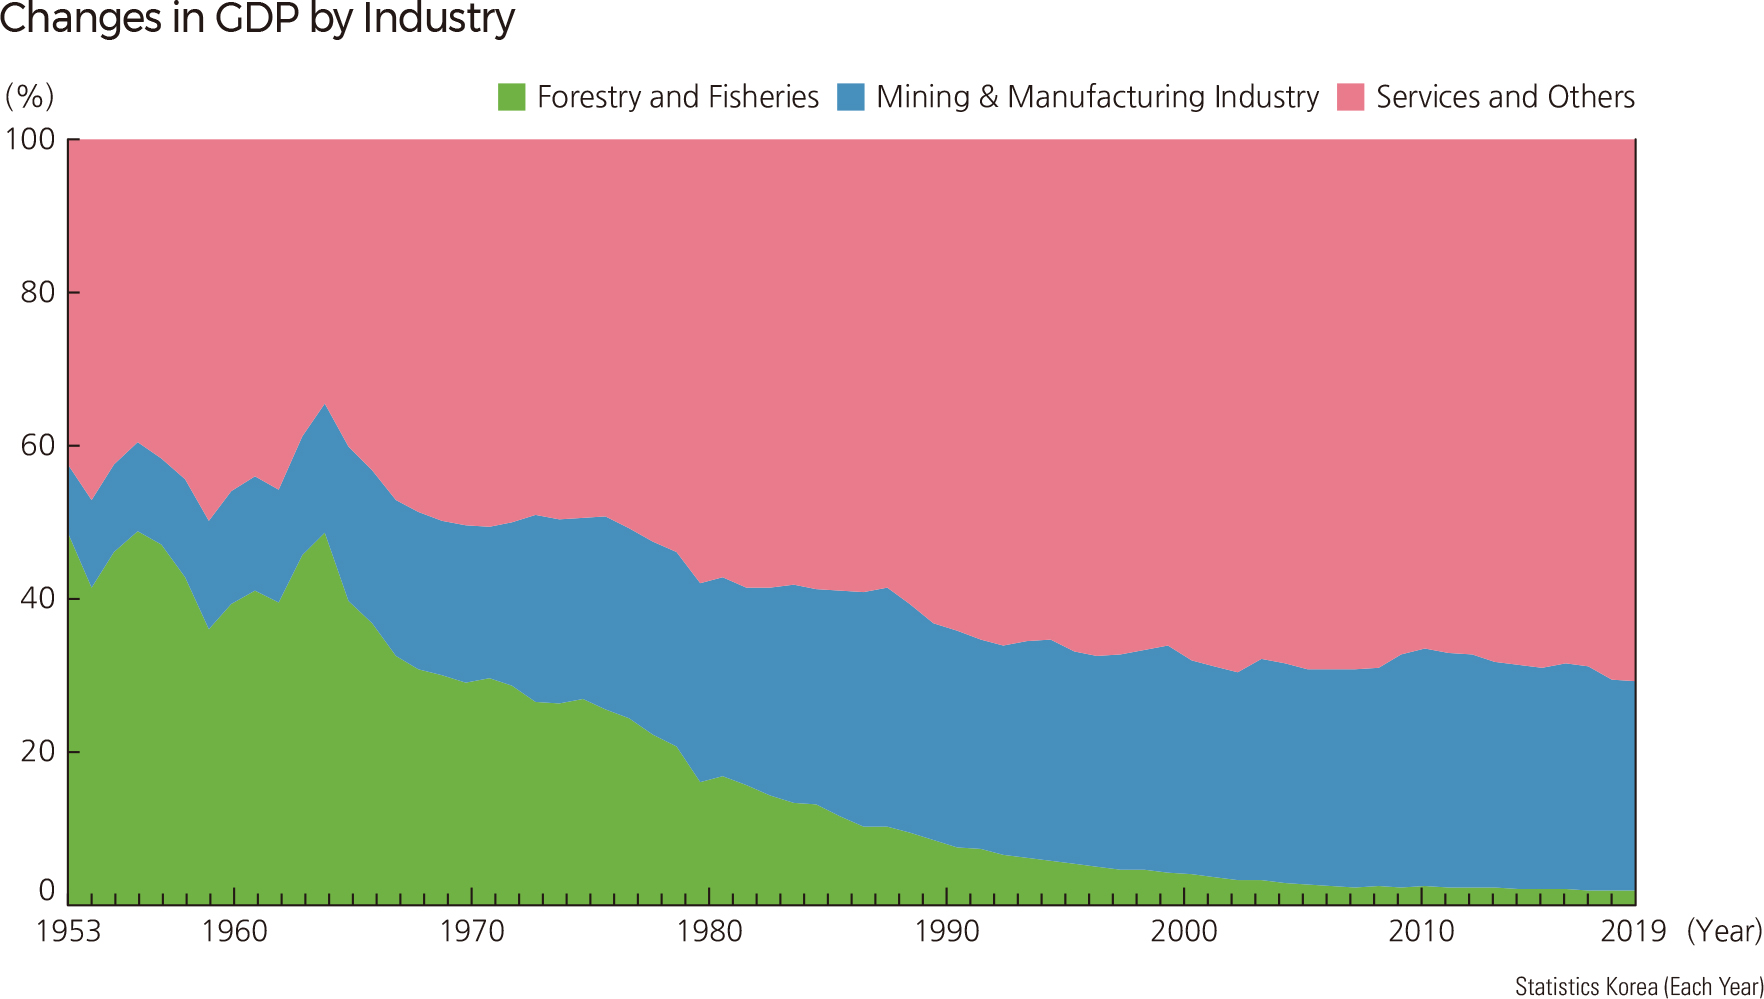
The economic indices have been used to understand the economic power of a country and to predict the future of business cycles. They are often measured by using various statistically valid indicators. Each country adopts different sets of indices for its national atlas. For example, the National Atlas of the United States includes the economic indices, such as per capita income, unemployment rate, per capita number of jobs, median household income, and per capita average wage of employees. The National Atlas of Canada selects only income-related economic indicators, such as median household income, male median income, and female median income. In this National Atlas of Korea, total regional gross domestic product (GDP), income and expenditure, the total number of establishments and employees, the value added by industries, international trade and balance of payments, research and development activities, and other statistical indicators are presented as economic indicators. Regional gross domestic product means the sum of the newly created final products and services rendered, i.e., the total value added during a specific time at a particular place. With other economic indices, the size of the regional economy, the level of production, and industrial structure can be deduced. Furthermore, these can be used as the basis for establishing regional economic policies and for conducting regional economic research. If this regional gross domestic product (RGDP) is expanded to the national level, it could be the national gross domestic product; however, the data used for the estimation and the methodologies may vary and may not necessarily be the same. According to the World Bank, Korea’s gross domestic product (nominal basis) was ranked 10th in the world in 2020 at 1,637 billion USD. In 1972, the gross domestic product was just over 10 billion USD. In 1985, 15 years later, it increased ten times, exceeding 100 billion USD. In 2006, 35 years after it first exceeded 10 billion USD, it broke through the 100-fold increase of 1 trillion USD. This growth pattern demonstrates that Korea has achieved accelerated economic growth in a compressed time frame. The change in the GDP growth rate in the pre-1960 period remained less than 5%. The change in the GDP growth rate reached 9.5% in the 1960s (1961–1970), 9.3% in the 1970s (1971–1980), and 10% in the 1980s (1981–1990), with the highest growth rate of almost 10% for some time during this period. But in the 1990s, the growth rate declined to 7.2%. In the 2000s, it dropped to 4.6%, and in the 2010s, it decreased significantly to 2.5%. This declining growth rate indicates the slowing growth of the Korean economy. Since 2010, growth has further slowed, with a growth rate of less than 4%. The proportion of the gross domestic product accounted for by the agriculture, forestry, and fishing industries declined sharply from 48.2% in 1953 to 28.9% in 1970, 8.4% in 1990, 2.4% in 2010, and only 2.0% in 2020. Meanwhile, mining and manufacturing had the proportion of 8.9% in 1953, 20.4% in 1970, 28.0% in 1990, and 30.3% in 2010, demonstrating a continuous increase. However, its trend turned into a decrease to 27.2% in 2020. Services and other tertiary sectors were at 42.4% in 1953, 50.7% in 1970, 63.6% in 1990, 67.3% in 2010, and 70.8% in 2020, showing a proportional increase. This change shows that the industrial structure of Korea was quickly reorganized after 1970, with industry’s proportion of the gross domestic product moving from primary industry to secondary and tertiary industries. |