English III
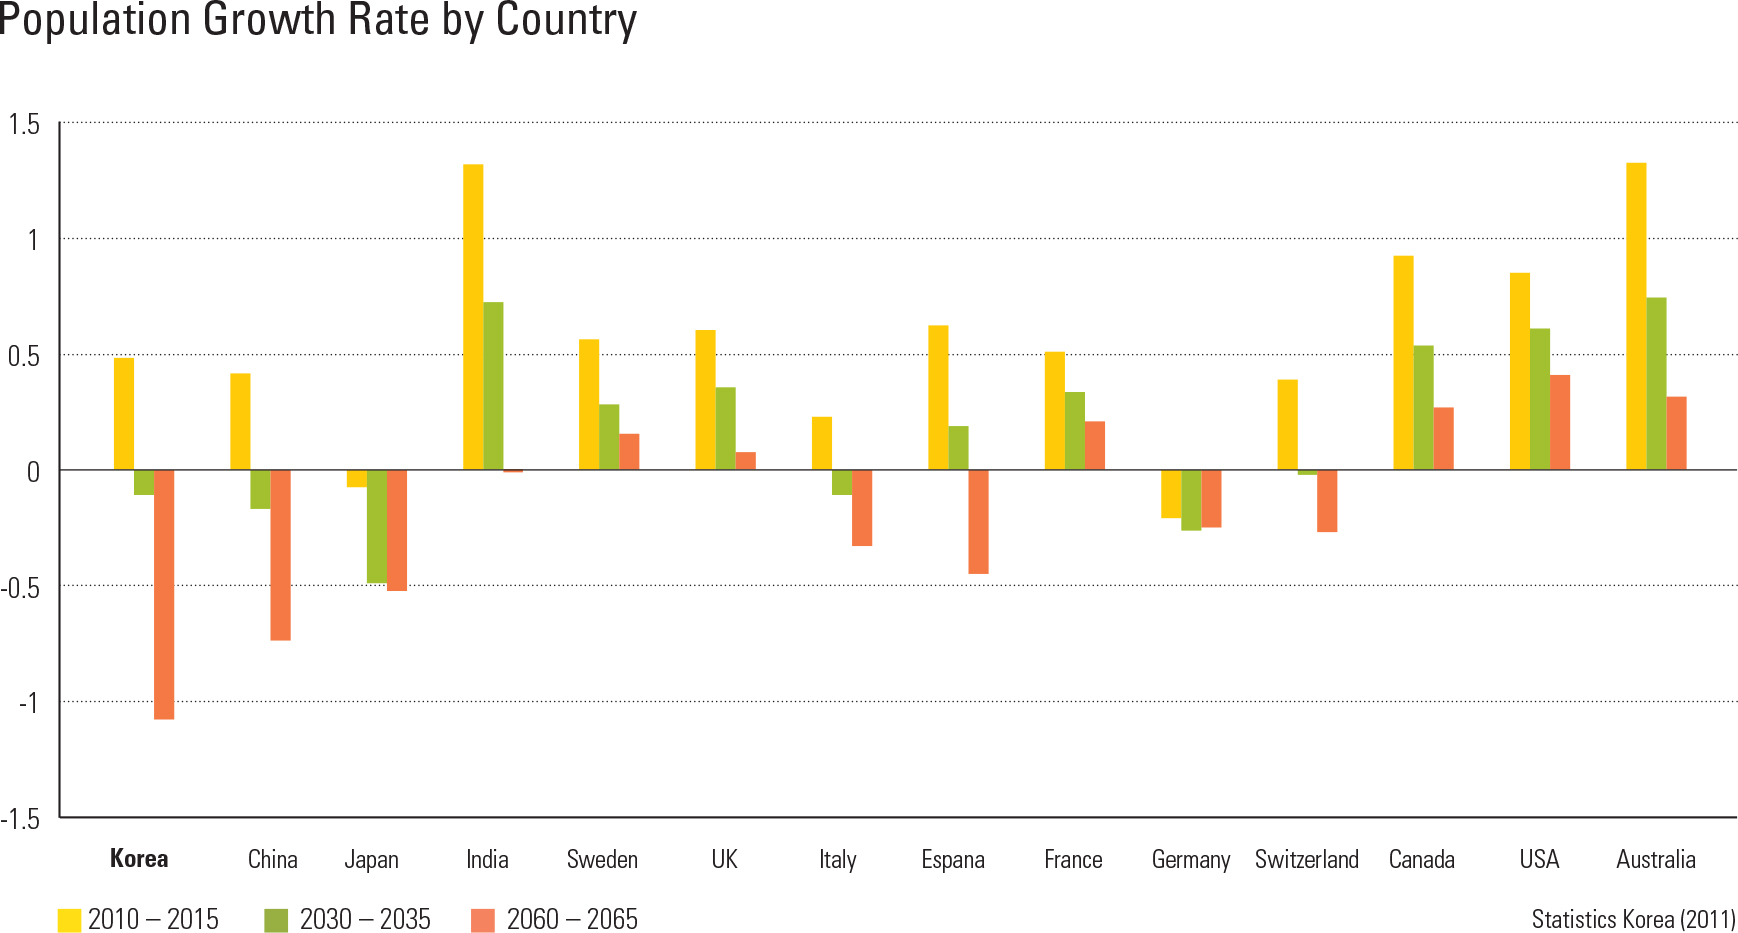
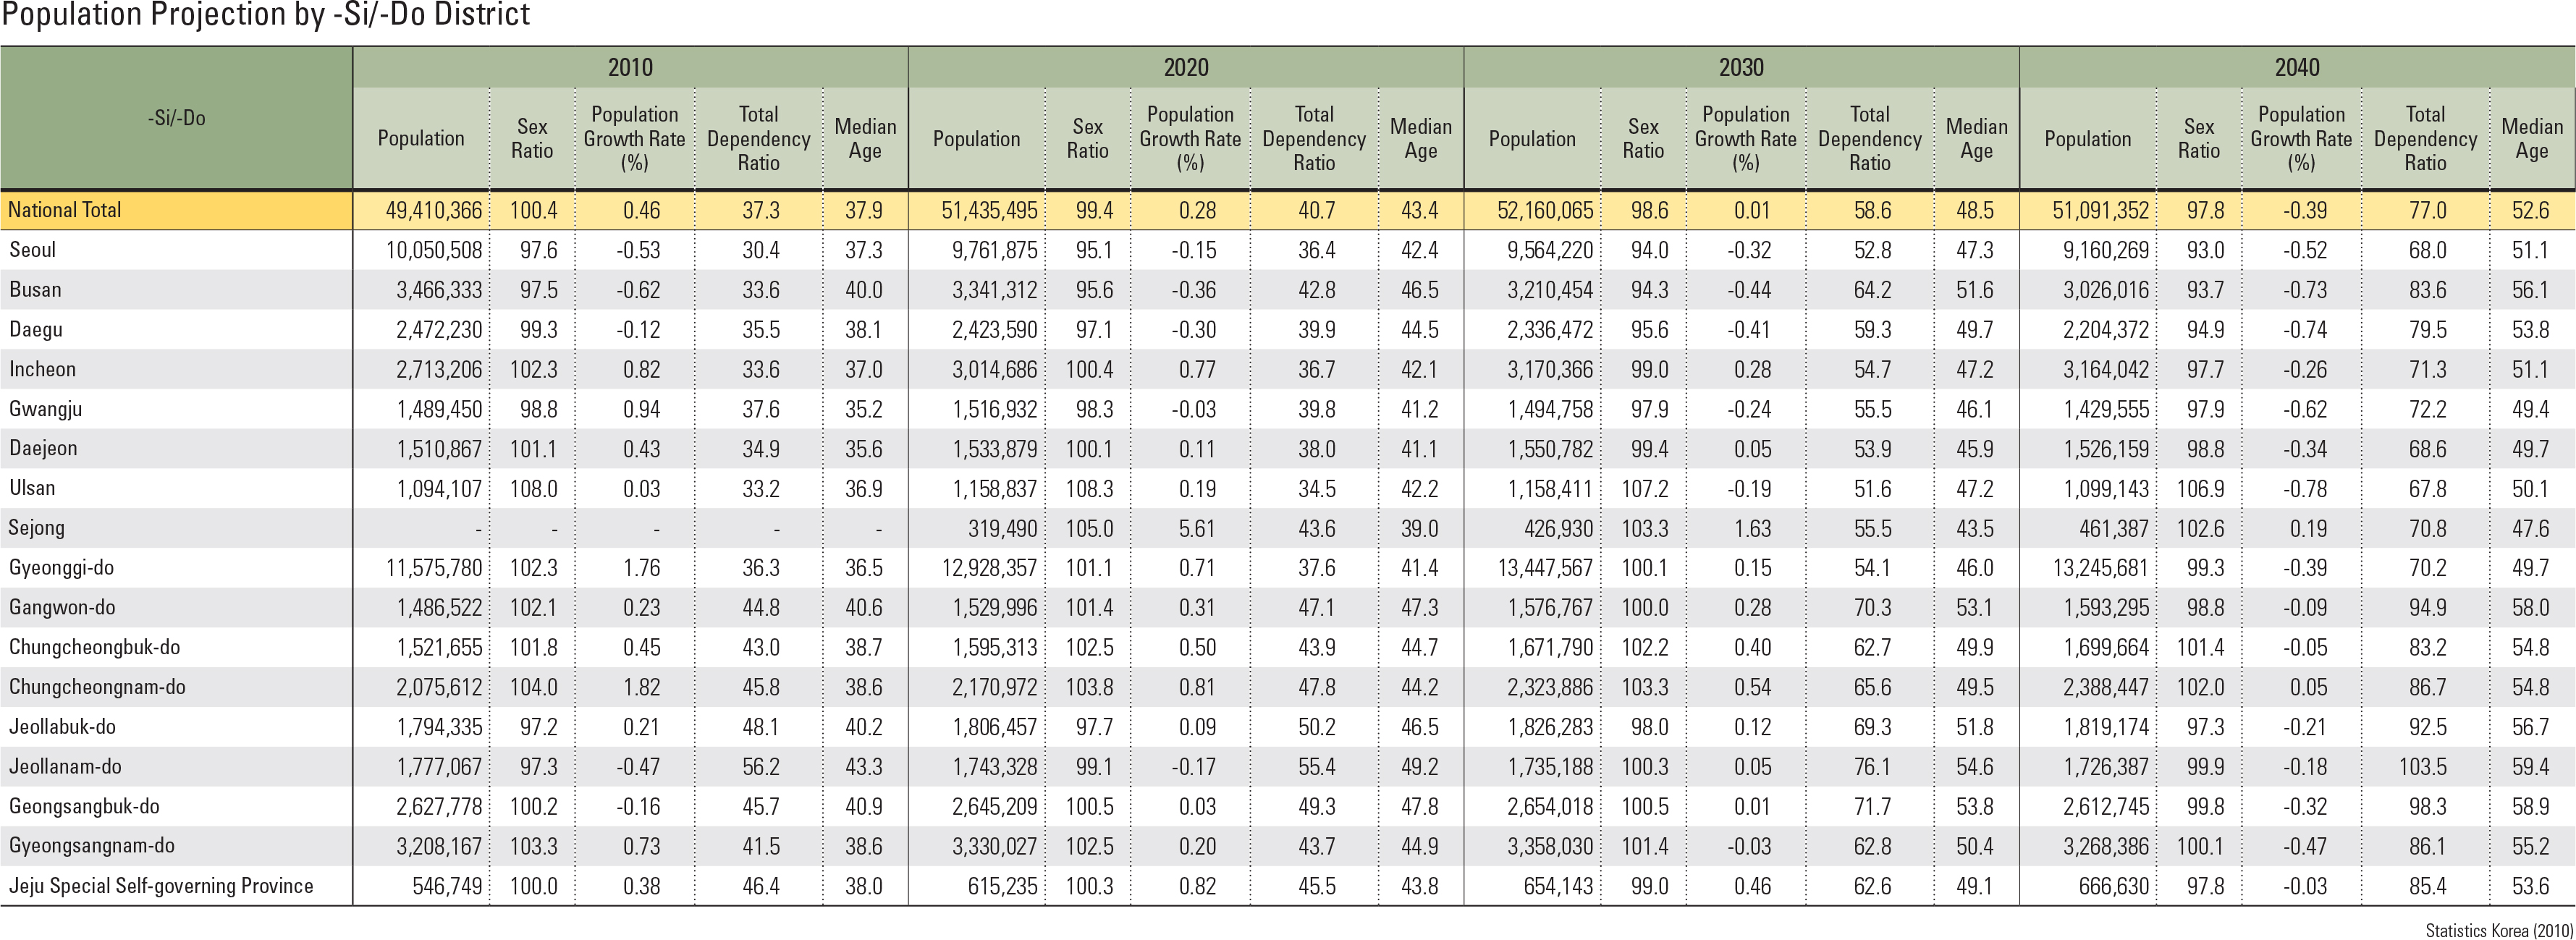
In 2011, Statistics Korea estimated and pro- jected changes in Korea’s population structure through the year 2060 by gender and age. The estimation was made with the cohort component method using the 2010 population census data and the vital statistics and international migra- tion data since 2005. Population estimation was conducted with three different growth scenarios: median-growth, high-growth, and low-growth. According to the median-growth scenario, Ko- rea’s population will increase from 49.41 million in 2010 to 52.16 million in 2030. Then it will decrease and return to the 1992 level of 43.96 million by 2060. In the high-growth scenario, the population will peak in 2041 at 57.15 million, then decrease to 54.78 million by 2060. In the low-growth scenario, the population will peak at 50.02 million in 2016, then return to the 1974 lev- el of 34.47 million by 2060.Korea’s population pyramids from 1960 to 2060 show how Korea’s population structure changes over a century. The 1960 population pyr- amid shows many young dependents and a small elderly population, which is typical for develop- ing countries. The 2010 population pyramid is a bell-shaped structure that has the majority of the population in the middle section with low birth and death rates, which is often found in countries with advanced economies. The 2060 population pyramid estimated with a median-growth assump- tion shows an inverse triangular plot structure where the elderly population (60 or order) is the majority (47.4%).
page_2 |


